Act IThe Injustice
Start with the cause
In 2024 the average person on Earth was responsible for 4.7 tonnes of CO₂. An Australian: 14.5. An American: 14.2. The average Pacific Islander: 1.3 tonnes.
Add up every island nation on this chart and you get 0.046% of global emissions. If climate change has authors, they are not here.
Two territories sit higher — New Caledonia smelts nickel, and small diesel grids are inefficient by nature. Even counting them, the region barely registers.
Now the consequence
Since satellite records began in 1993, the sea around these islands has climbed roughly 12 centimetres — in parts of the western Pacific, faster than the global average. Surface temperatures run about +0.6 °C above the mid-century norm and keep rising.
The cause lives elsewhere. The consequence arrives daily.
The injustice, measured
If a country's own emissions wrote its fate, this cloud would slope upward: burn more, suffer more. It does not. The correlation is r = −0.30 — statistically indistinguishable from zero (p = 0.28).
In this sample, a nation's observed sea-level anomaly does not track with what it burns. Its exposure is not explained by its own emissions.
InterludeWe looked for excuses
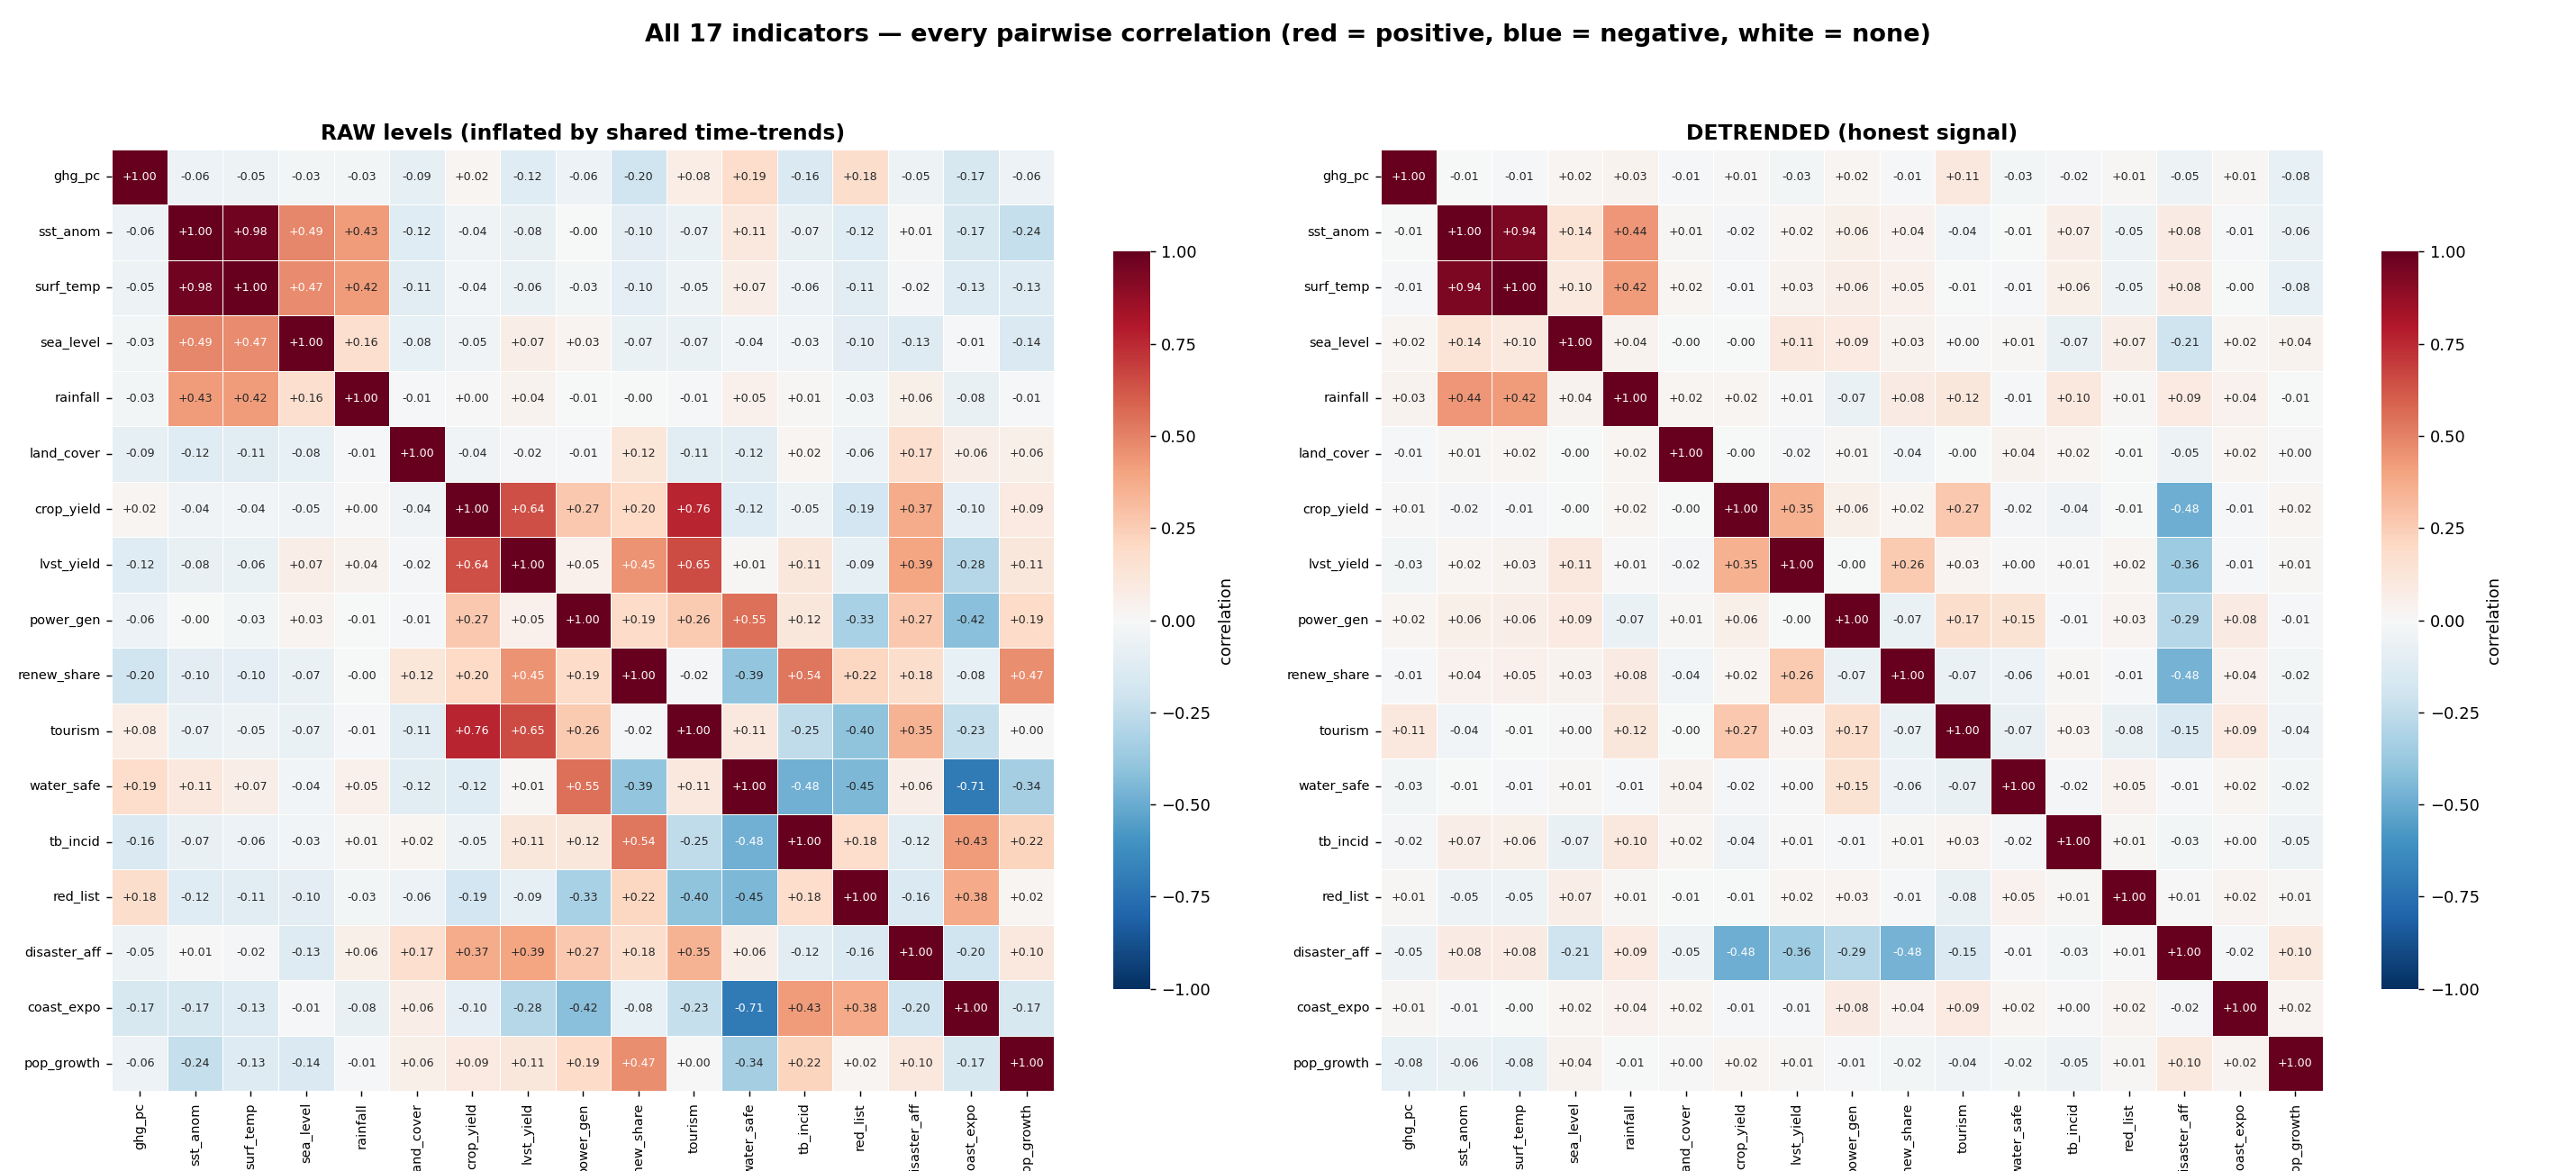
Before choosing this story, we tried to make another explanation win: maybe Pacific climate risk simply follows what each country emits, or maybe a wider indicator panel would point to a cleaner cause.
The heatmap is an exploratory audit sheet, not a public score claim. The reproducible result we carry into the story is narrower: across 17 countries, own GHG per person and local sea-level anomaly show no statistically detectable association (r = −0.30, permutation p = 0.28).
Act IIThe Frontline Low-lying island nations — Tuvalu, Kiribati, the Marshalls — live at the ocean's edge, with nowhere to retreat
The splash zone
Across the atoll nations, almost everyone lives in the splash zone. In the Marshall Islands 96% of people live less than ten metres above the sea; in Tuvalu 91%; in Nauru 76%; in Kiribati 74%.
There is no inland to retreat to, no uphill, no behind. When the ocean rises a centimetre, it rises on everyone.
Shocks, not trends
Disasters arrive as events. Cyclone Winston (2016) reached 633,584 people — 69% of Fiji. Cyclone Harold (2020) touched 83% of Vanuatu. Tuvalu's 2022 drought put 77% of the country under a water emergency.
On islands this small, no disaster is ever local.
The slowest emergency
Across the Pacific, safely managed drinking water still reaches only about 69% of people in the median country. Coverage varies sharply across the 15 countries with comparable series, and the values are modelled estimates.
Sea level takes decades. Thirst takes a season.
Act IIIThe Fight Back
They did not cause it. They fight it anyway.
Pacific solar generation in 2000: 1.4 GWh. In 2023: 602 GWh — about 430 times as much, from New Caledonia's solar farms to panels beside Samoan churches.
On the region's smallest grids, the sun is no longer a token — it now carries a double-digit share of the power.
An honest scoreboard
Honesty cuts both ways: diesel still keeps most of the lights on — 73% of the region's generation is fossil, and demand keeps growing. The wedge of sun and water widens each year, against real odds.
And even a perfect Pacific transition would not move the global needle — that was Act I. They fight anyway.
And they keep watch
From 5 meteorological stations in 1940 to 56 across 18 countries today. An early-warning lattice built patiently by nations that refuse to be surprised by storms they did not summon.
The story in three numbers
What to carry forward
- 0.046%
- Pacific share of global CO₂ emissions 17 of 21 island countries and territories with OWID data
- 96%
- of Marshall Islands residents live below 10 metres Pacific Data Hub · low-elevation coastal zone
- 430×
- growth in Pacific solar generation, 2000–2023 1.4 to 602.4 GWh · Pacific Data Hub
If a nation's climate exposure does not track with its own emissions —
whose emissions shape the risk, and what do the largest emitters owe?
The Pacific's answer is not despair. It is solar panels, water tanks and weather stations — and a demand that the authors of this fate own it.